It’s been a little while since my last blog post. And even though I have a lot of things I would like to write about, I always find it a bit hard to take the time to do so. Luckily, I just received a new laptop, so I’m not bound to sit on my desktop to get some work done anymore.
Very recently, I was introduced to a simple and superfast data-access profiler, called MiniProfiler. So to everyone that wants to profile the API performance of their application, this is a very good alternative when thinking about cost-benefit.
What is MiniProfiler
The description they give is: MiniProfiler is a library and UI for profiling your application. By letting you see where your time is spent, which queries are run, and any other custom timings you want to add, MiniProfiler helps you debug issues and optimize performance.
In short, it is a library that you add to your back-end application to enable profiling of data-access.
Initial setup with .NET 6 and EF Core
In my case, it was used with .NET 6 and the EntityFramework Core package in back-end, but in addition I also added an implementation in our front-end application for displaying the profiling results, which at the time is on Angular version 15 (newest).
To start using MiniProfiler, we had to install the MiniProfiler.AspNetCore.Mvc and MiniProfiler.EntityFrameworkCore NuGet packages. Then we could add the code for the middleware setup, with options related to things like:
- Who/what should be profiled?
- Who should have access to profile results?
- Should we add the userId to the profilings?
- Which type of SQL formatter should be used.
For instance, you can set up that only users that are authenticated in your application should be profiled. But to be able to access these profilings, you need to have a special permission or be a superuser of some sort.
See here for full example code.
Extended setup using Angular
The setup above is enough to make use of MiniProfiler. Because you can access these endpoints to get information about the profiling requests:
- /results
- /results-list
- /results-index
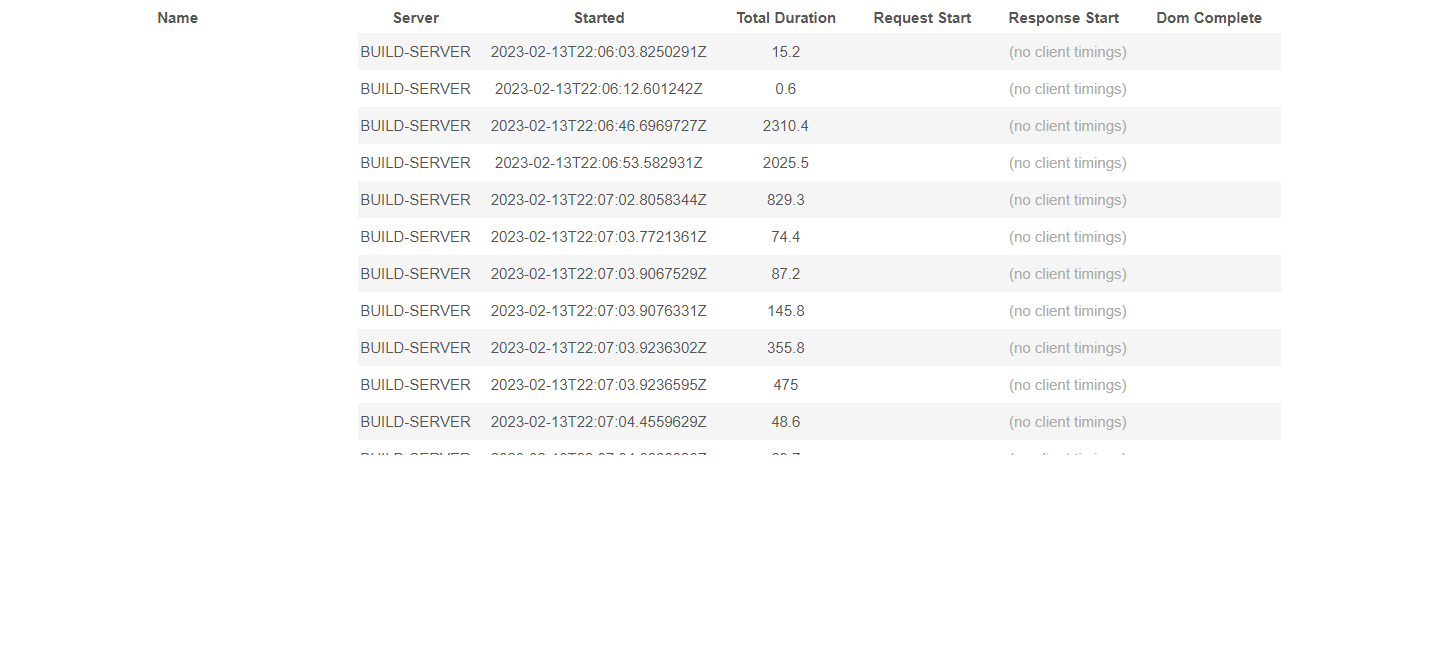
For example, this is how the result-index looks like, listing all available results in an easy fasion, where you then can drill into the specific requests to see how the code was traversed + the linq to SQL query transformations to pinpoint where the performance bottlenecks are (name/urls are removed in my example):

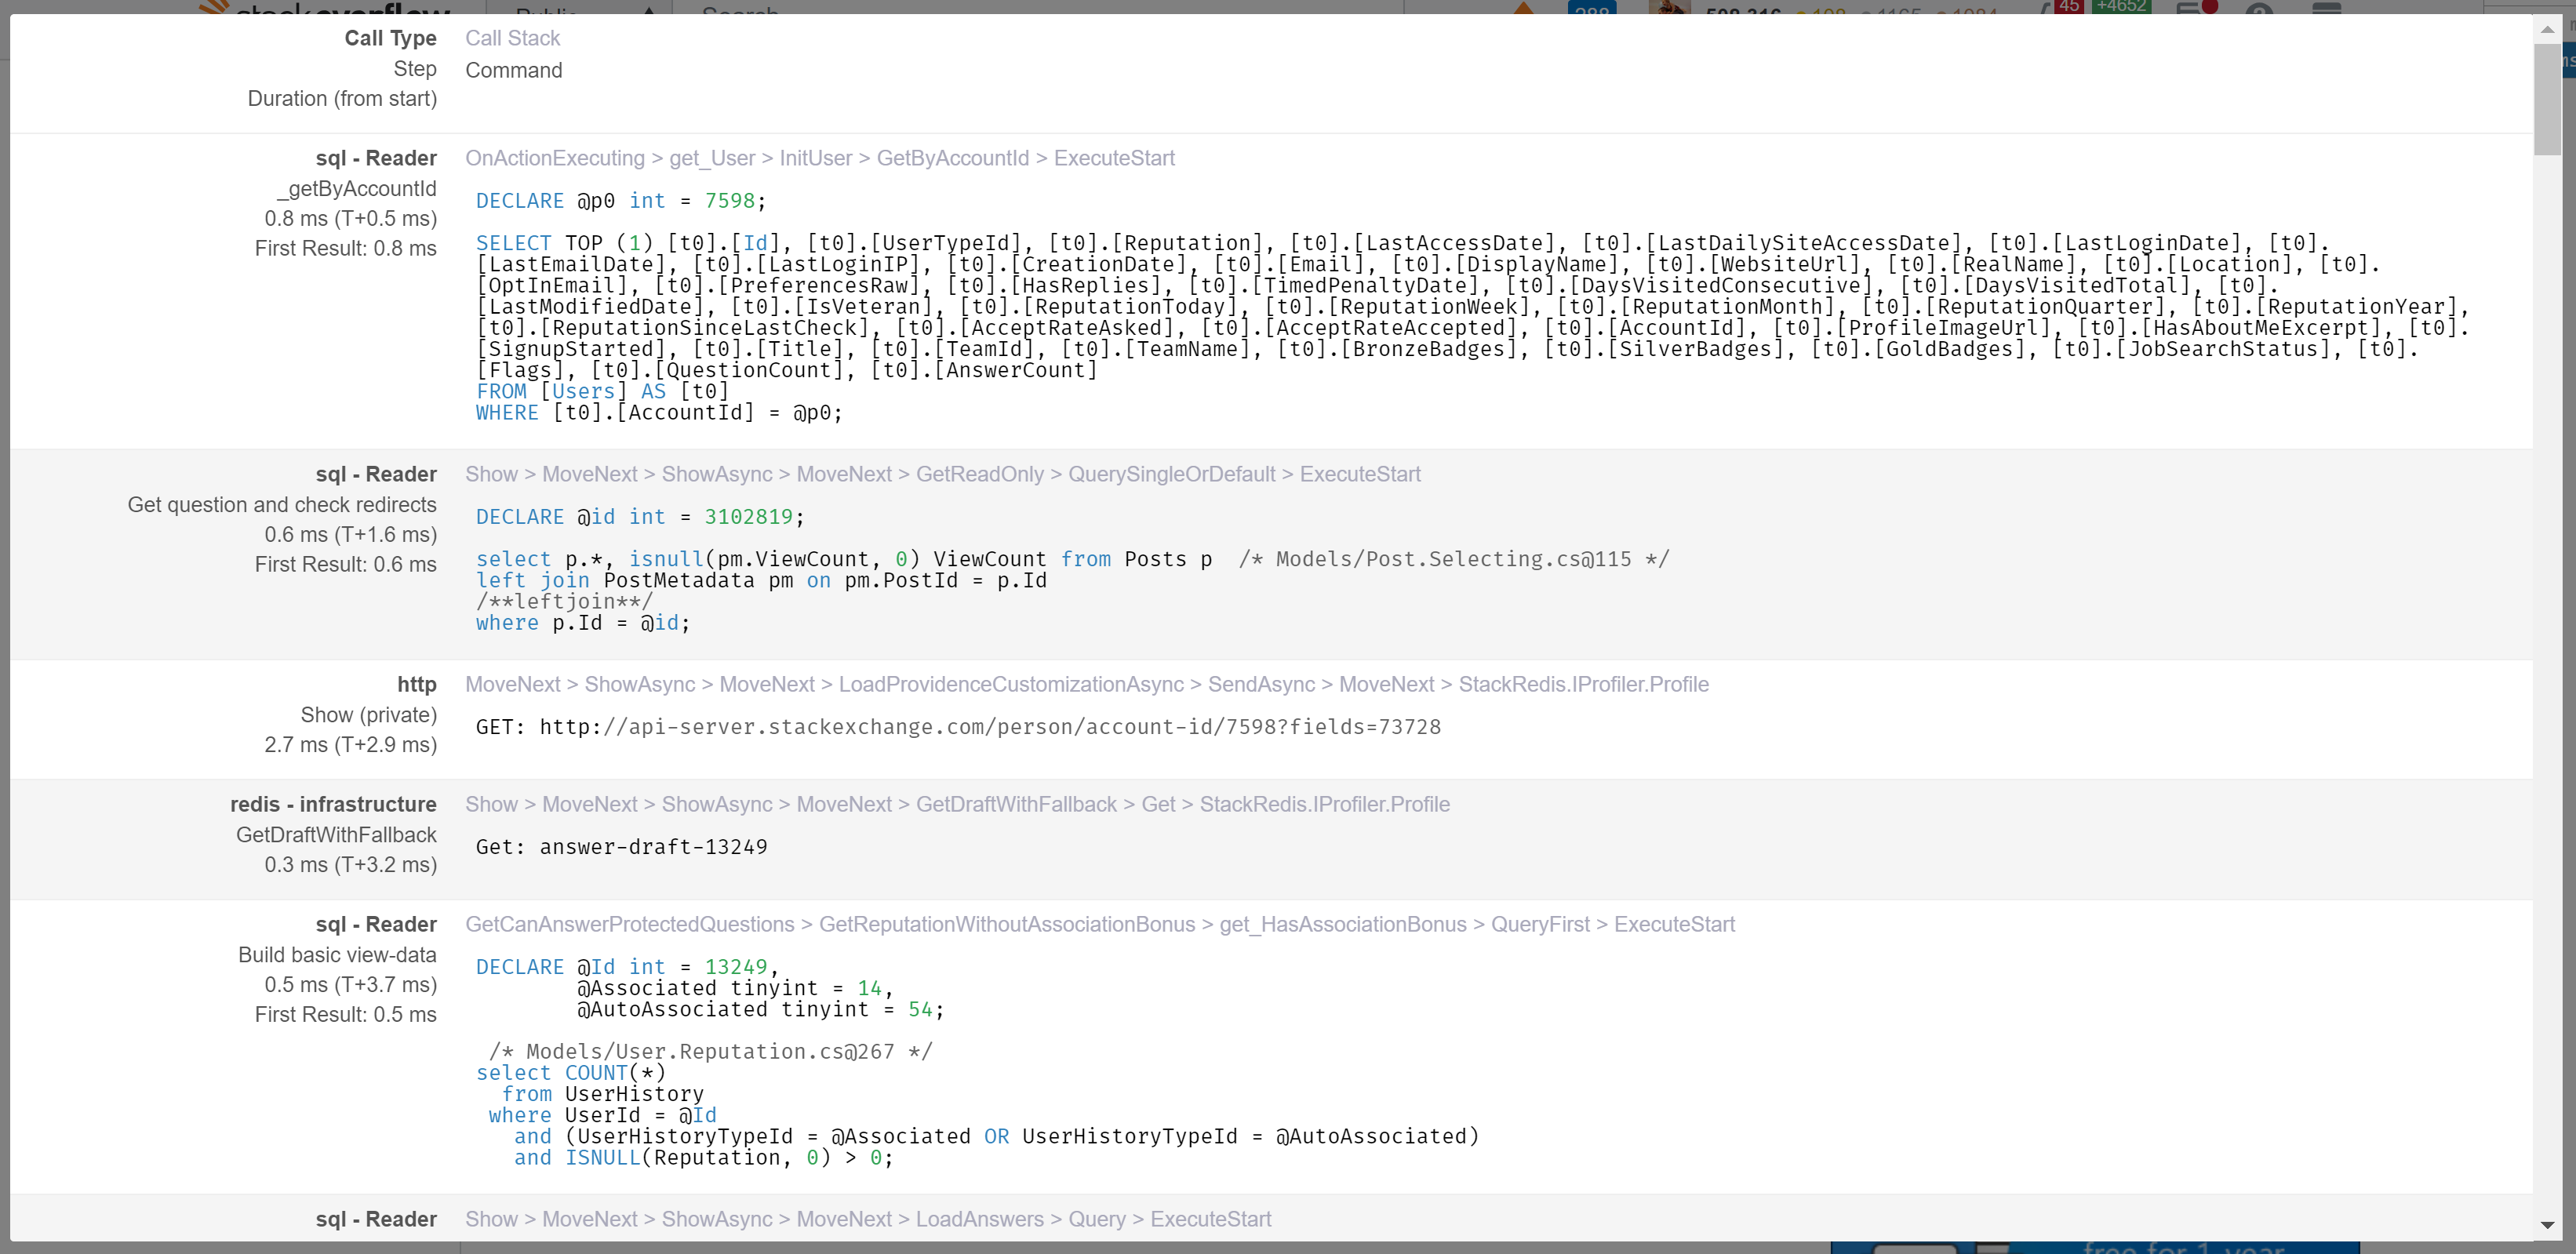
Drill-down:

But in order to enhance the experience for the end-user even more, I created an Angular library that connects to, and enabled, MiniProfiler in the front-end UI using the JavaScript from the MiniProfiler library. It utilizes on all the capabilities of the MiniProfiler library, adding options for placement, toggling it on/off, theming, number of traces being displayed and more.
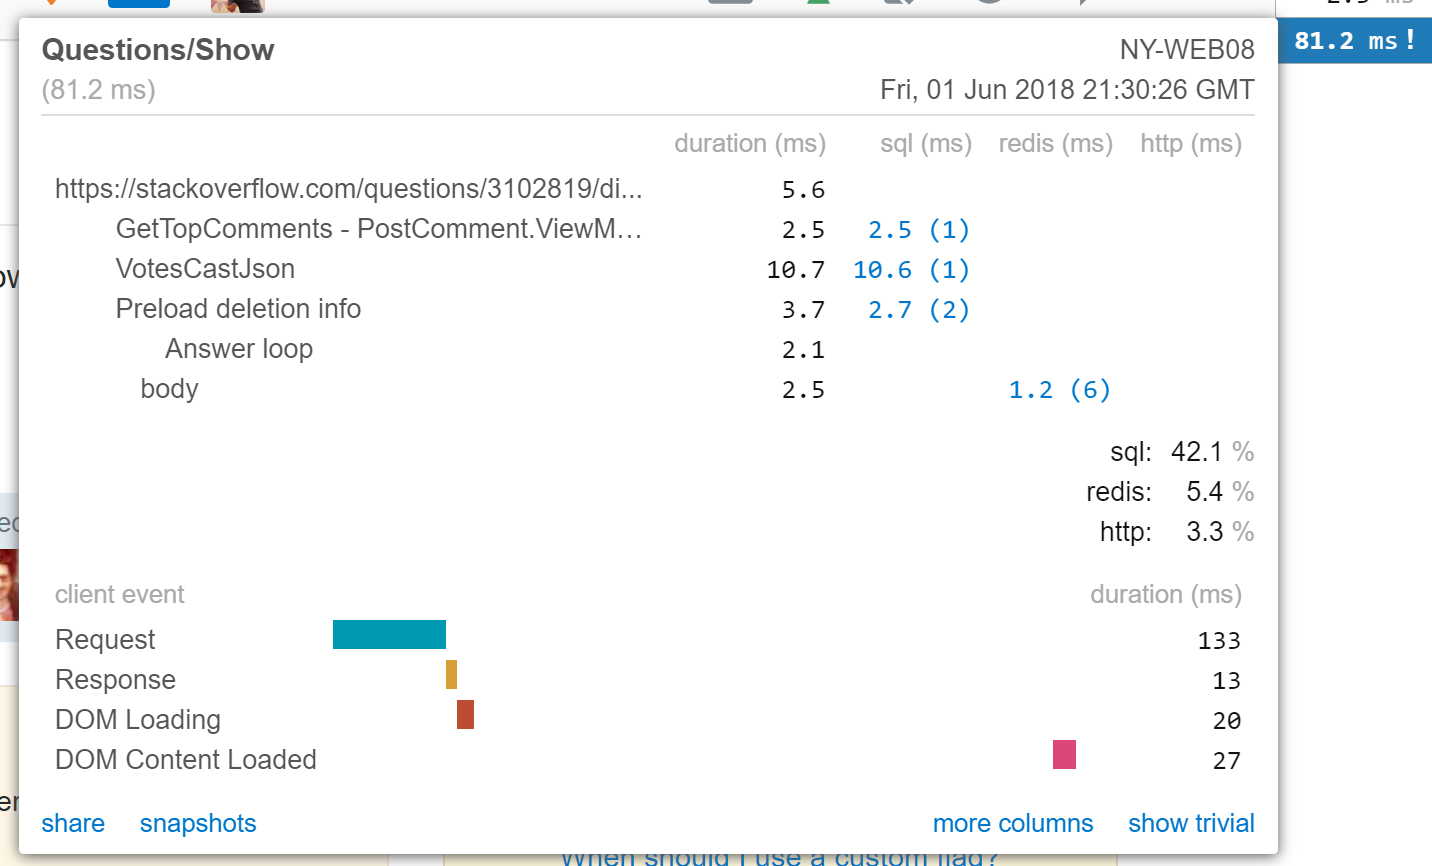
This makes it very easy to see live performance profiling while navigating the application, where you then can click on the rows to drill into them for more information. You will also see exclamation marks on requests that are slower than a certain threshold (this is also configurable):

NPM package for reusability
After my initial implementation in the first front-end application connecting to our back-end, I knew that this was something that probably would be interesting to plug-and-play for other products in our company as well.
So instead of making the front-end code very tailored for that one application, I instead generalized it and published it as an NPM package in our private GitHub registry. This was actually super easy, using NX to create a publishable library with one of their built-in generators. I will come back and write more about NX in several later blog posts, as that is a fantastic build-system that really takes your Angular application to the next level.
I then used that same NPM package in one of our other products, and instead of having to write several hundred lines of code, I only needed to add about 40-50 lines to make it work. How great isn’t that?
